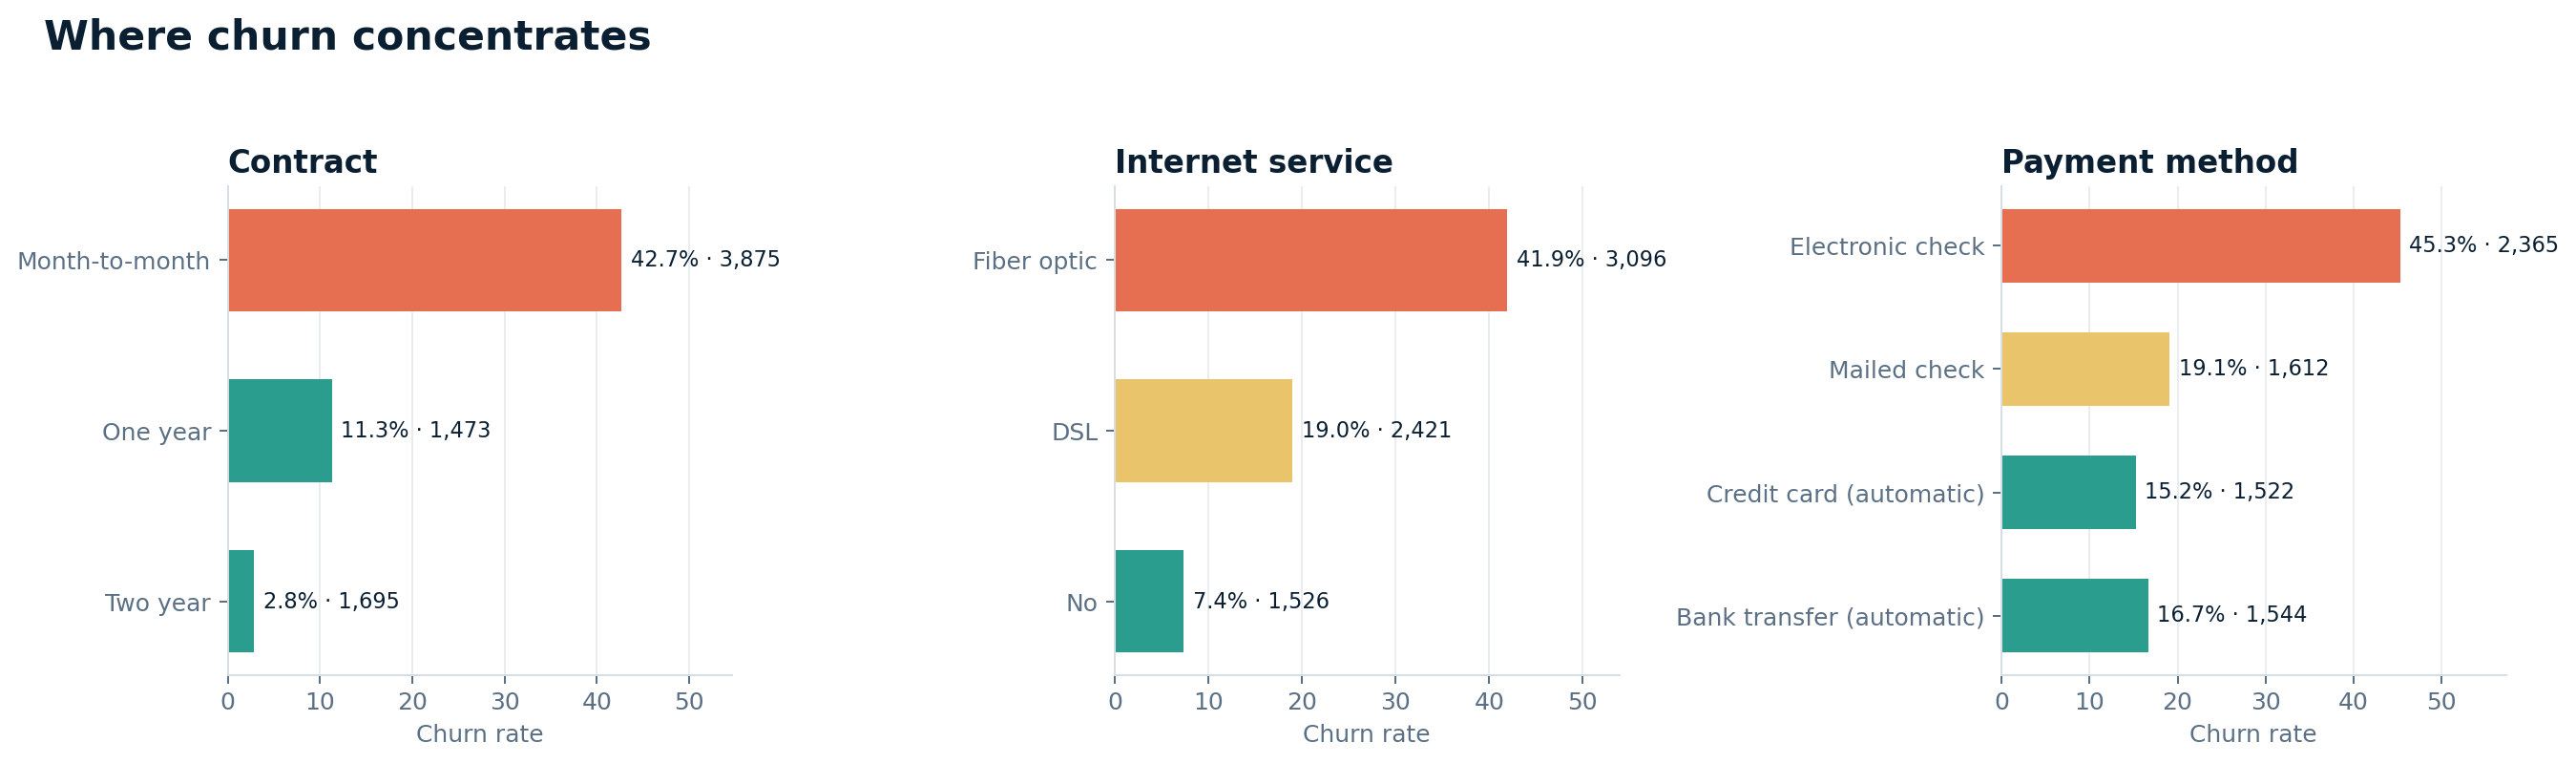
Month-to-month accounts churn at roughly four times the two-year rate.
Versus 11.3% on one-year and 2.8% on two-year contracts. Commitment length is the strongest segment signal in the data.
Customer retention intelligence · portfolio project
A reproducible churn model and retention workbench built on 7,043 IBM Telco customers. It turns a probability ranking into an explicit contact policy — with the evaluation, trade-offs, and limits on the table.
Live client-side scorer · logistic regression · 0.846 holdout ROC-AUC · threshold tuned out-of-fold · one-time holdout evaluation
Cumulative churn captured
66.0%in the top three risk deciles — 247 of 374 holdout churners.
01The signal
Three observable account facts carry most of the signal — and most of the revenue exposure. The model is most useful when it ranks the next-best accounts inside those segments, not when it treats every customer as equally urgent.
Versus 11.3% on one-year and 2.8% on two-year contracts. Commitment length is the strongest segment signal in the data.
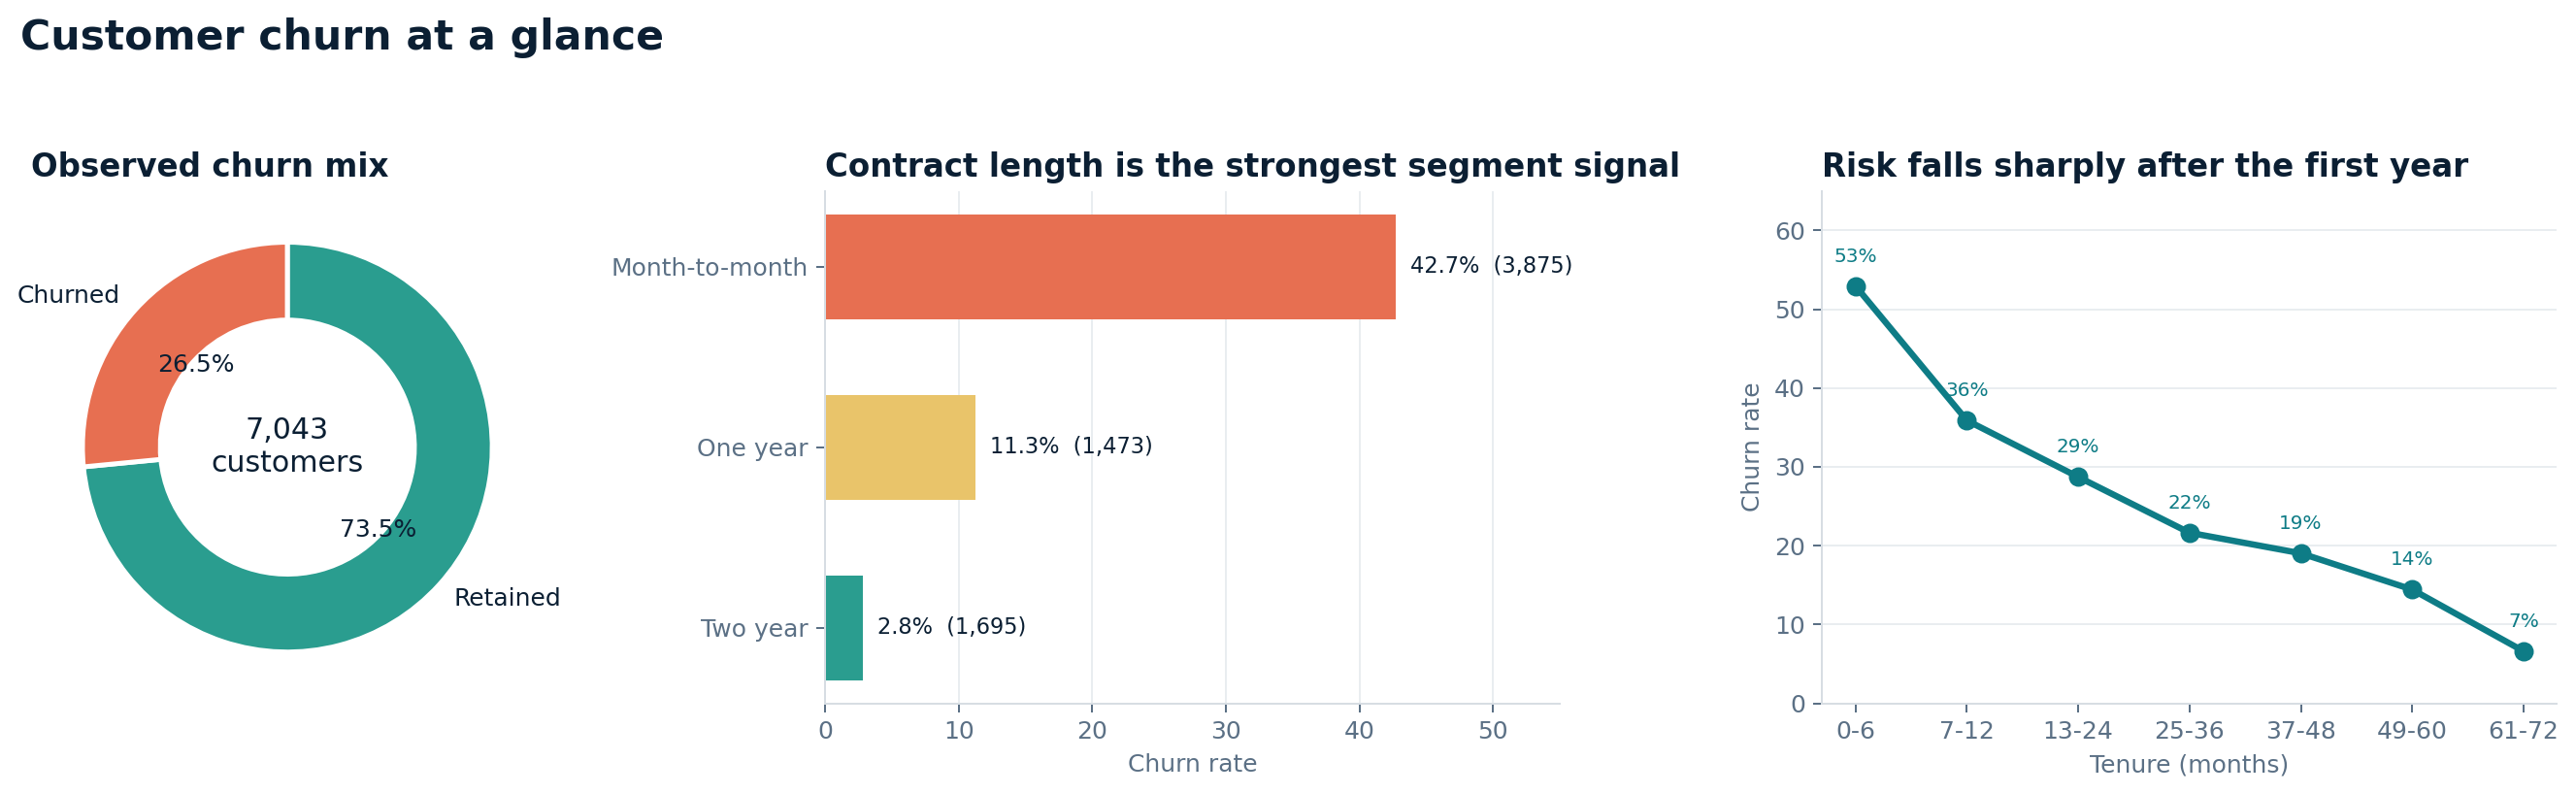
Risk falls sharply after the first year and reaches 6.6% in the 61–72 month cohort. Onboarding is a retention window, not a footnote.
The highest-risk large segment — and the clearest campaign target. This is the pool where a focused retention motion has the most leverage.
The actionable overlap
Month-to-month fiber accounts are not a niche. They are a large, measurable pool where a focused retention motion has the most leverage. The model's ranking decides which accounts inside that pool a team works first.
02The workbench
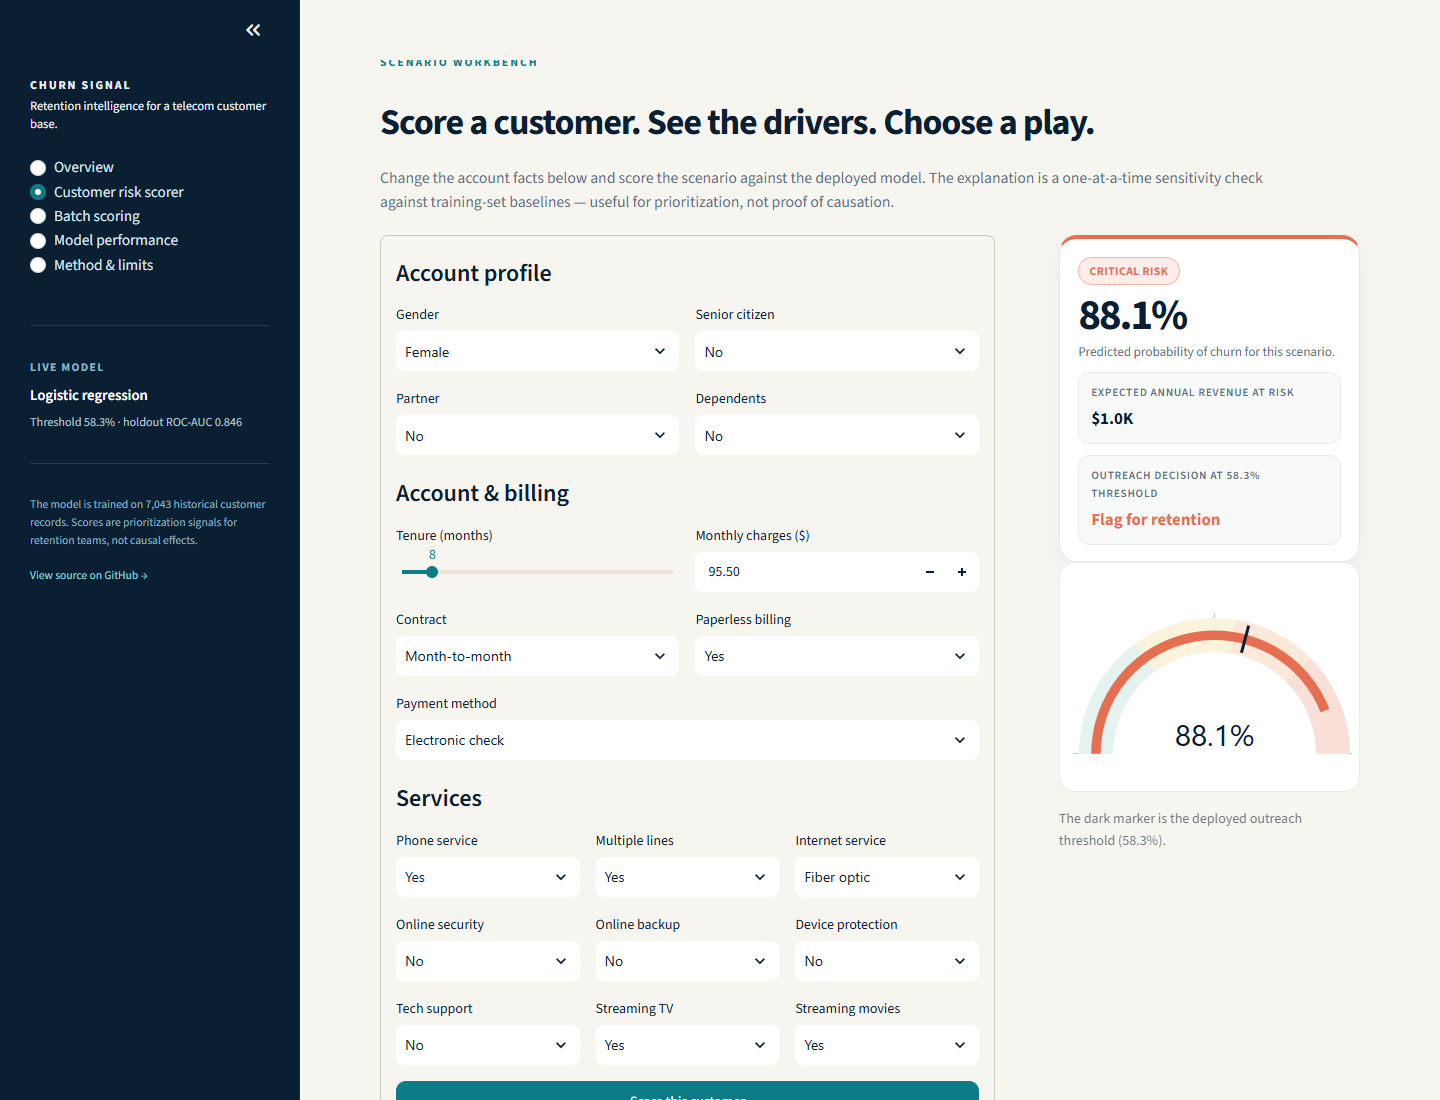
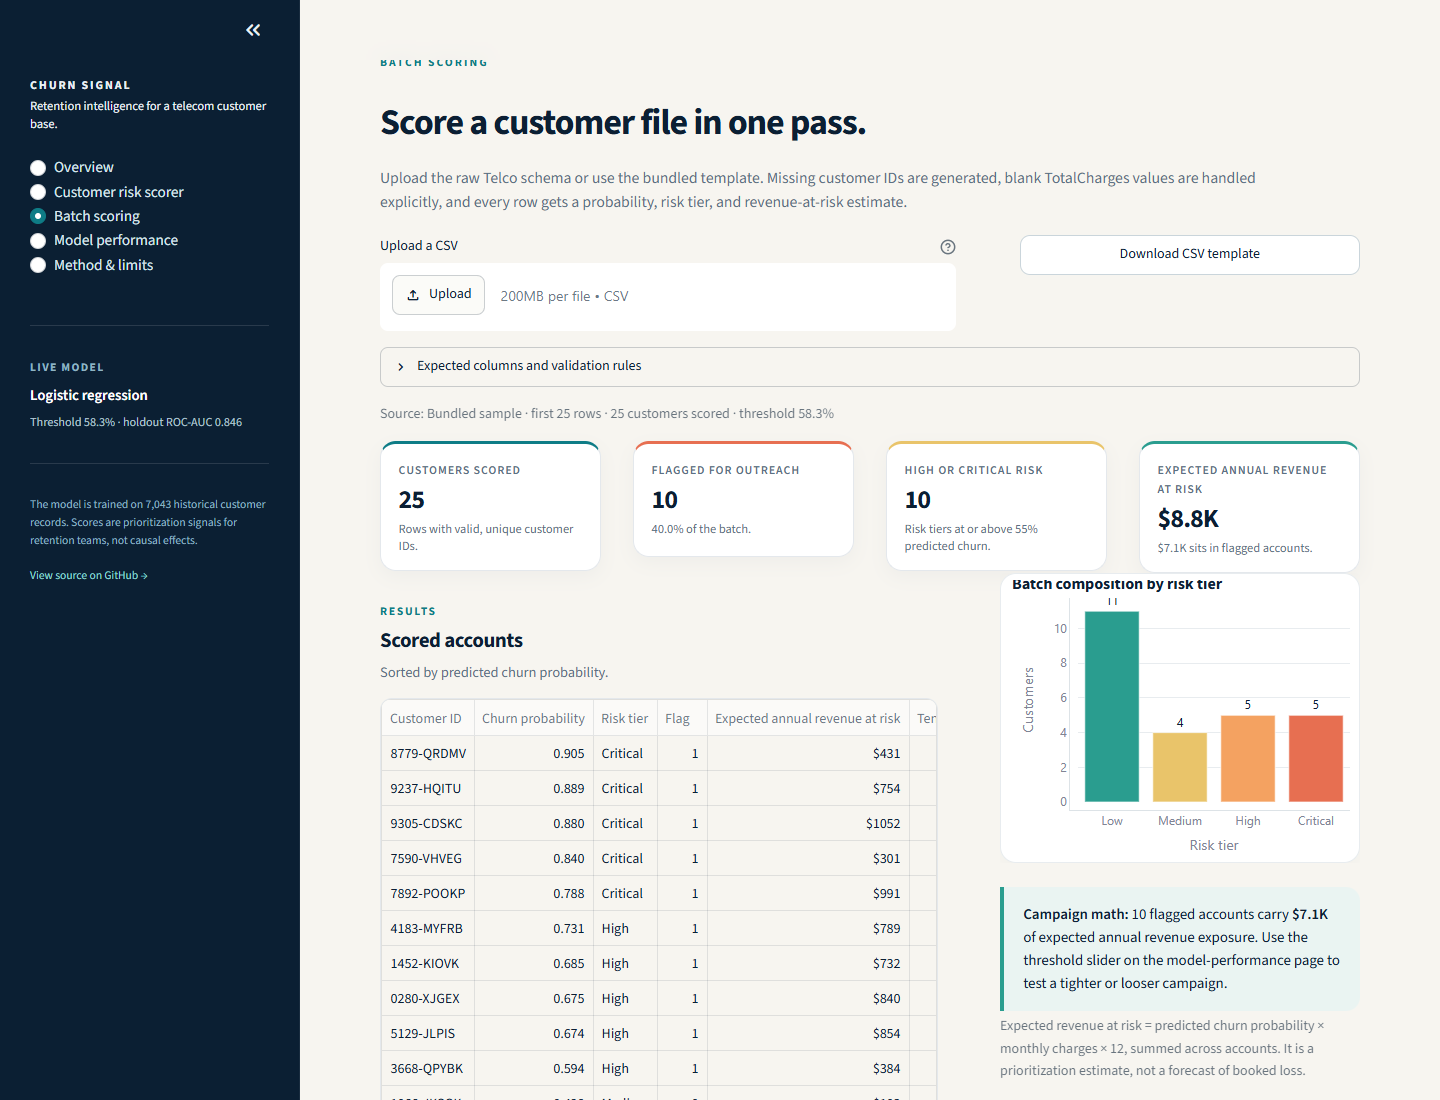
The Streamlit app turns the model into five linked surfaces: an executive overview, a single-customer scenario workbench, batch scoring, a threshold sandbox, and the method notes. The public browser scorer is the same fitted model exported to JavaScript; the Streamlit pages remain the full native reference.
Change tenure, contract, services, and billing facts. The score, risk tier, revenue at risk, drivers, and retention plays update together.
Upload the raw Telco schema, validate every row, score the portfolio, and download a ranked campaign file.
Move the threshold and watch precision, recall, contact volume, and decile capture change against saved holdout predictions.
A model card, data dictionary, and reproduction steps live beside the scores — not in a footnote.
Try the model before you read the rest.
Single accounts, threshold lab, and CSV batch scoring — no login, no server.
03Evaluation
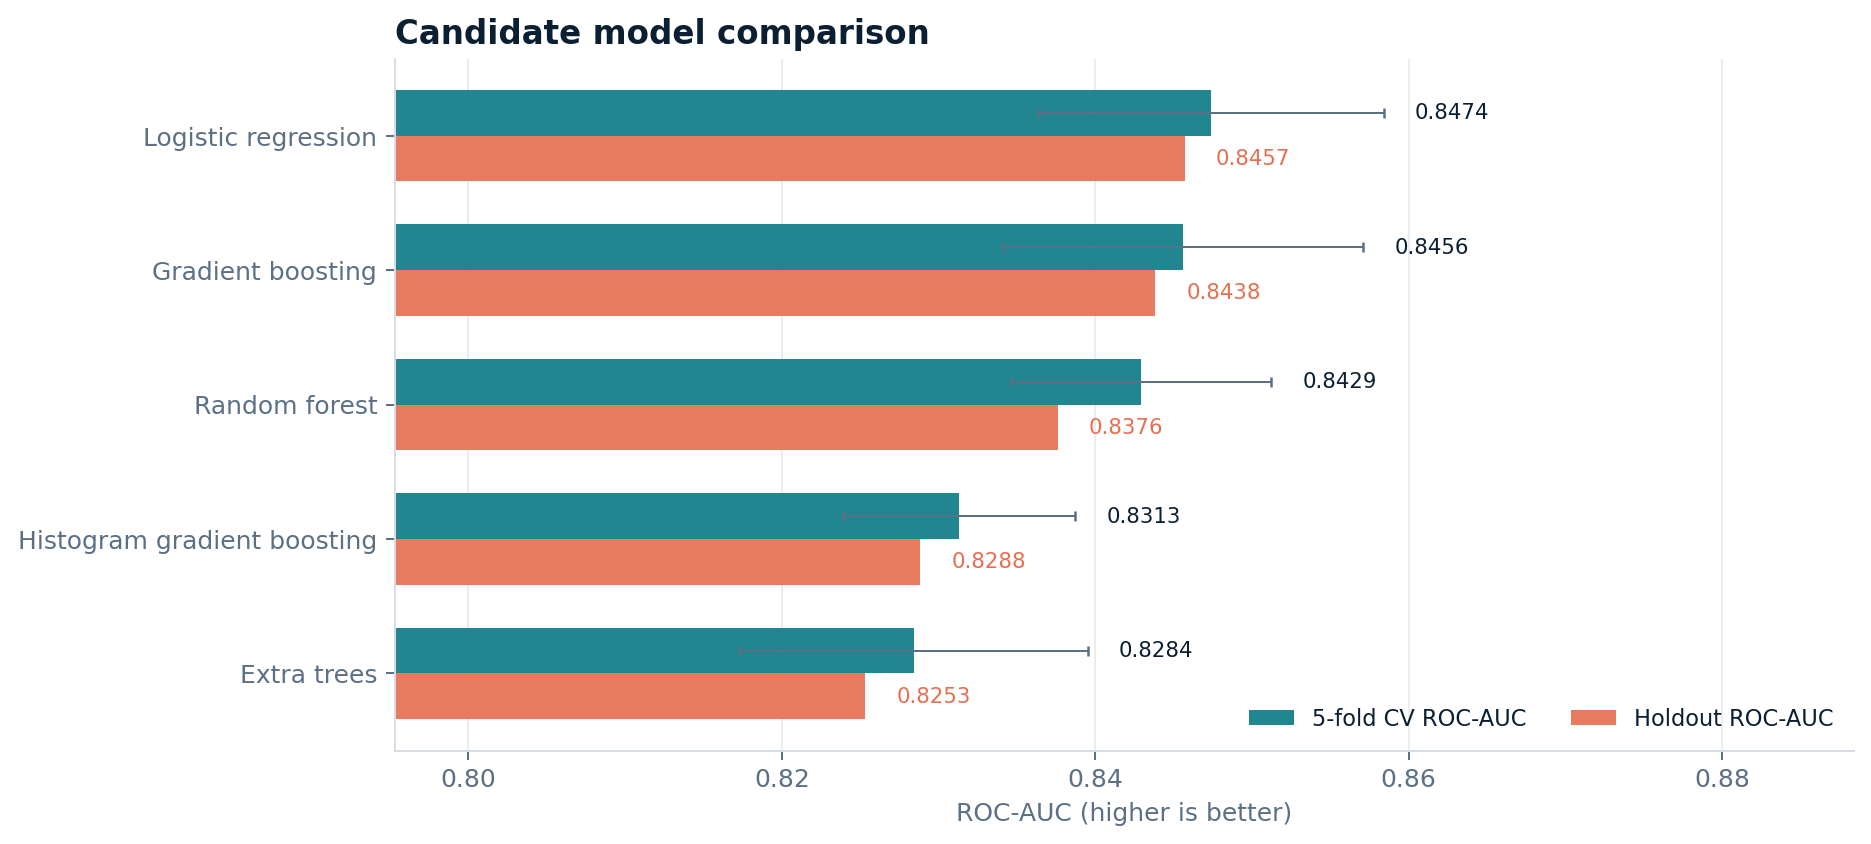
Five candidate pipelines are compared with 5-fold stratified CV ROC-AUC. The winner is evaluated once on a 20% holdout; the decision threshold is tuned on out-of-fold training predictions, not on the test set.
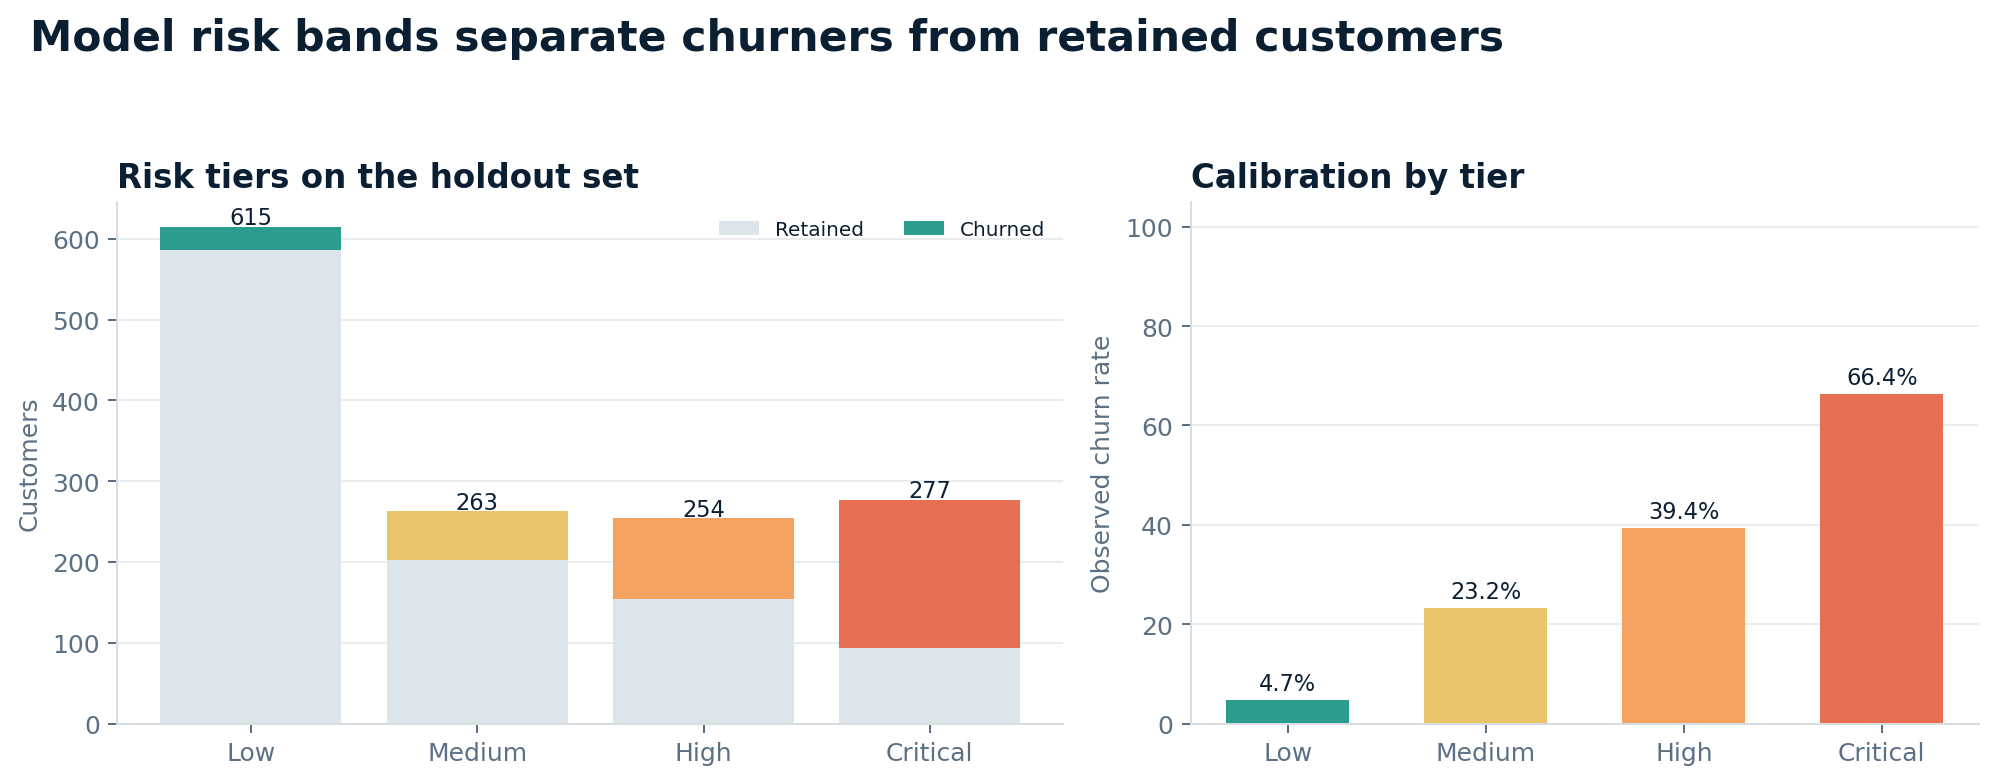
PR-AUC 0.6532 · F1 0.6236 · Brier 0.1657 · top-decile lift 2.86× · top three deciles capture 66.0% of holdout churners.
Why logistic regression?
It beat gradient boosting on CV ROC-AUC (0.8474 vs 0.8456), is easier to explain and monitor, and serializes to a 6.6 KB bundle. The extra complexity did not buy better holdout ranking.
Decision policy
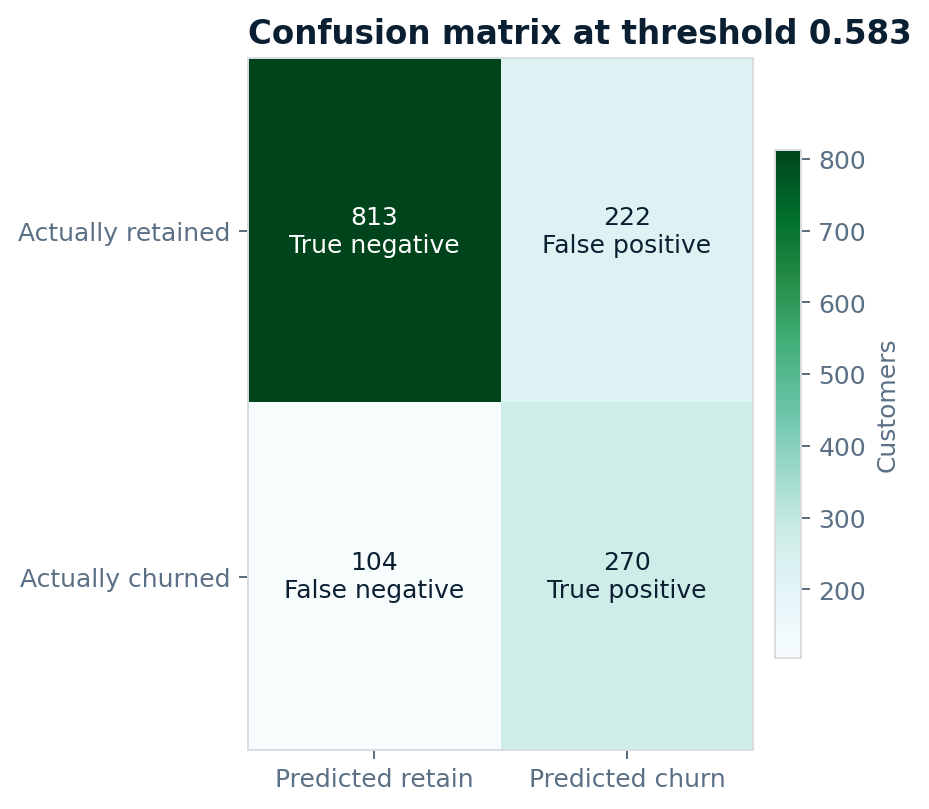
At the deployed threshold, 492 of 1,409 holdout accounts are flagged. The model catches 270 churners and contacts 222 retained customers. A lower threshold catches more churn; a higher one protects outreach capacity.
Permutation importance
The top five features account for 86.5% of the measured holdout importance. Correlated features can share credit.
04Method
A deterministic CLI takes the raw CSV to a serialized bundle, evaluation tables, and generated figures. The app reads those artifacts; it never retrains on page load.
Check required columns, unique customer IDs, numeric tenure and charges, and valid target labels.
Handle 11 blank TotalCharges records explicitly; add AvgMonthlySpend, ServiceCount, and IsNewCustomer.
Logistic regression, random forest, gradient boosting, histogram gradient boosting, and extra trees under 5-fold stratified CV.
Select the model by CV ROC-AUC. Tune the F1 threshold on out-of-fold training predictions, not on the holdout.
Score the 20% holdout, refit the winner on all labelled rows, and serialize the model, threshold, baselines, and metadata.
# clone and install
git clone https://github.com/mlaharsh/Customer_Churn_Prediction.git
cd Customer_Churn_Prediction
python -m venv .venv
# Windows
.venv\Scripts\activate
# macOS / Linux
# source .venv/bin/activate
pip install -r requirements-dev.txt
python -m churn.train
python -m pytest -q
streamlit run app.py
05Limits & responsible use
A useful model is honest about its boundary. This is a retrospective risk-ranking exercise, not a causal uplift study, a production credit system, or a guarantee of customer behavior.
One historical 80/20 split. There is no time-based validation or live experiment, and the historical Telco base may not represent a current customer population.
The what-if view resets one feature at a time. It can tell you which account facts are associated with risk, but not what a retention offer will change.
The Brier score is 0.1657. Scores are useful for ranking and campaign sizing; they should not be read as an individual's exact probability of leaving.
Gender and senior-citizen status are in the schema. Subgroup performance, score drift, alert rate, and realized churn require ongoing review before operational use.
If this went to production
The model is a starting point for a measured retention program, not a finished policy.
Open source · MIT
The model bundle, evaluation tables, tests, Docker image, CI workflows, and the Streamlit workbench are all in the repository. No hidden notebooks, no hand-typed metrics.